What Is a Good Website Conversion Rate? Benchmarks by Type
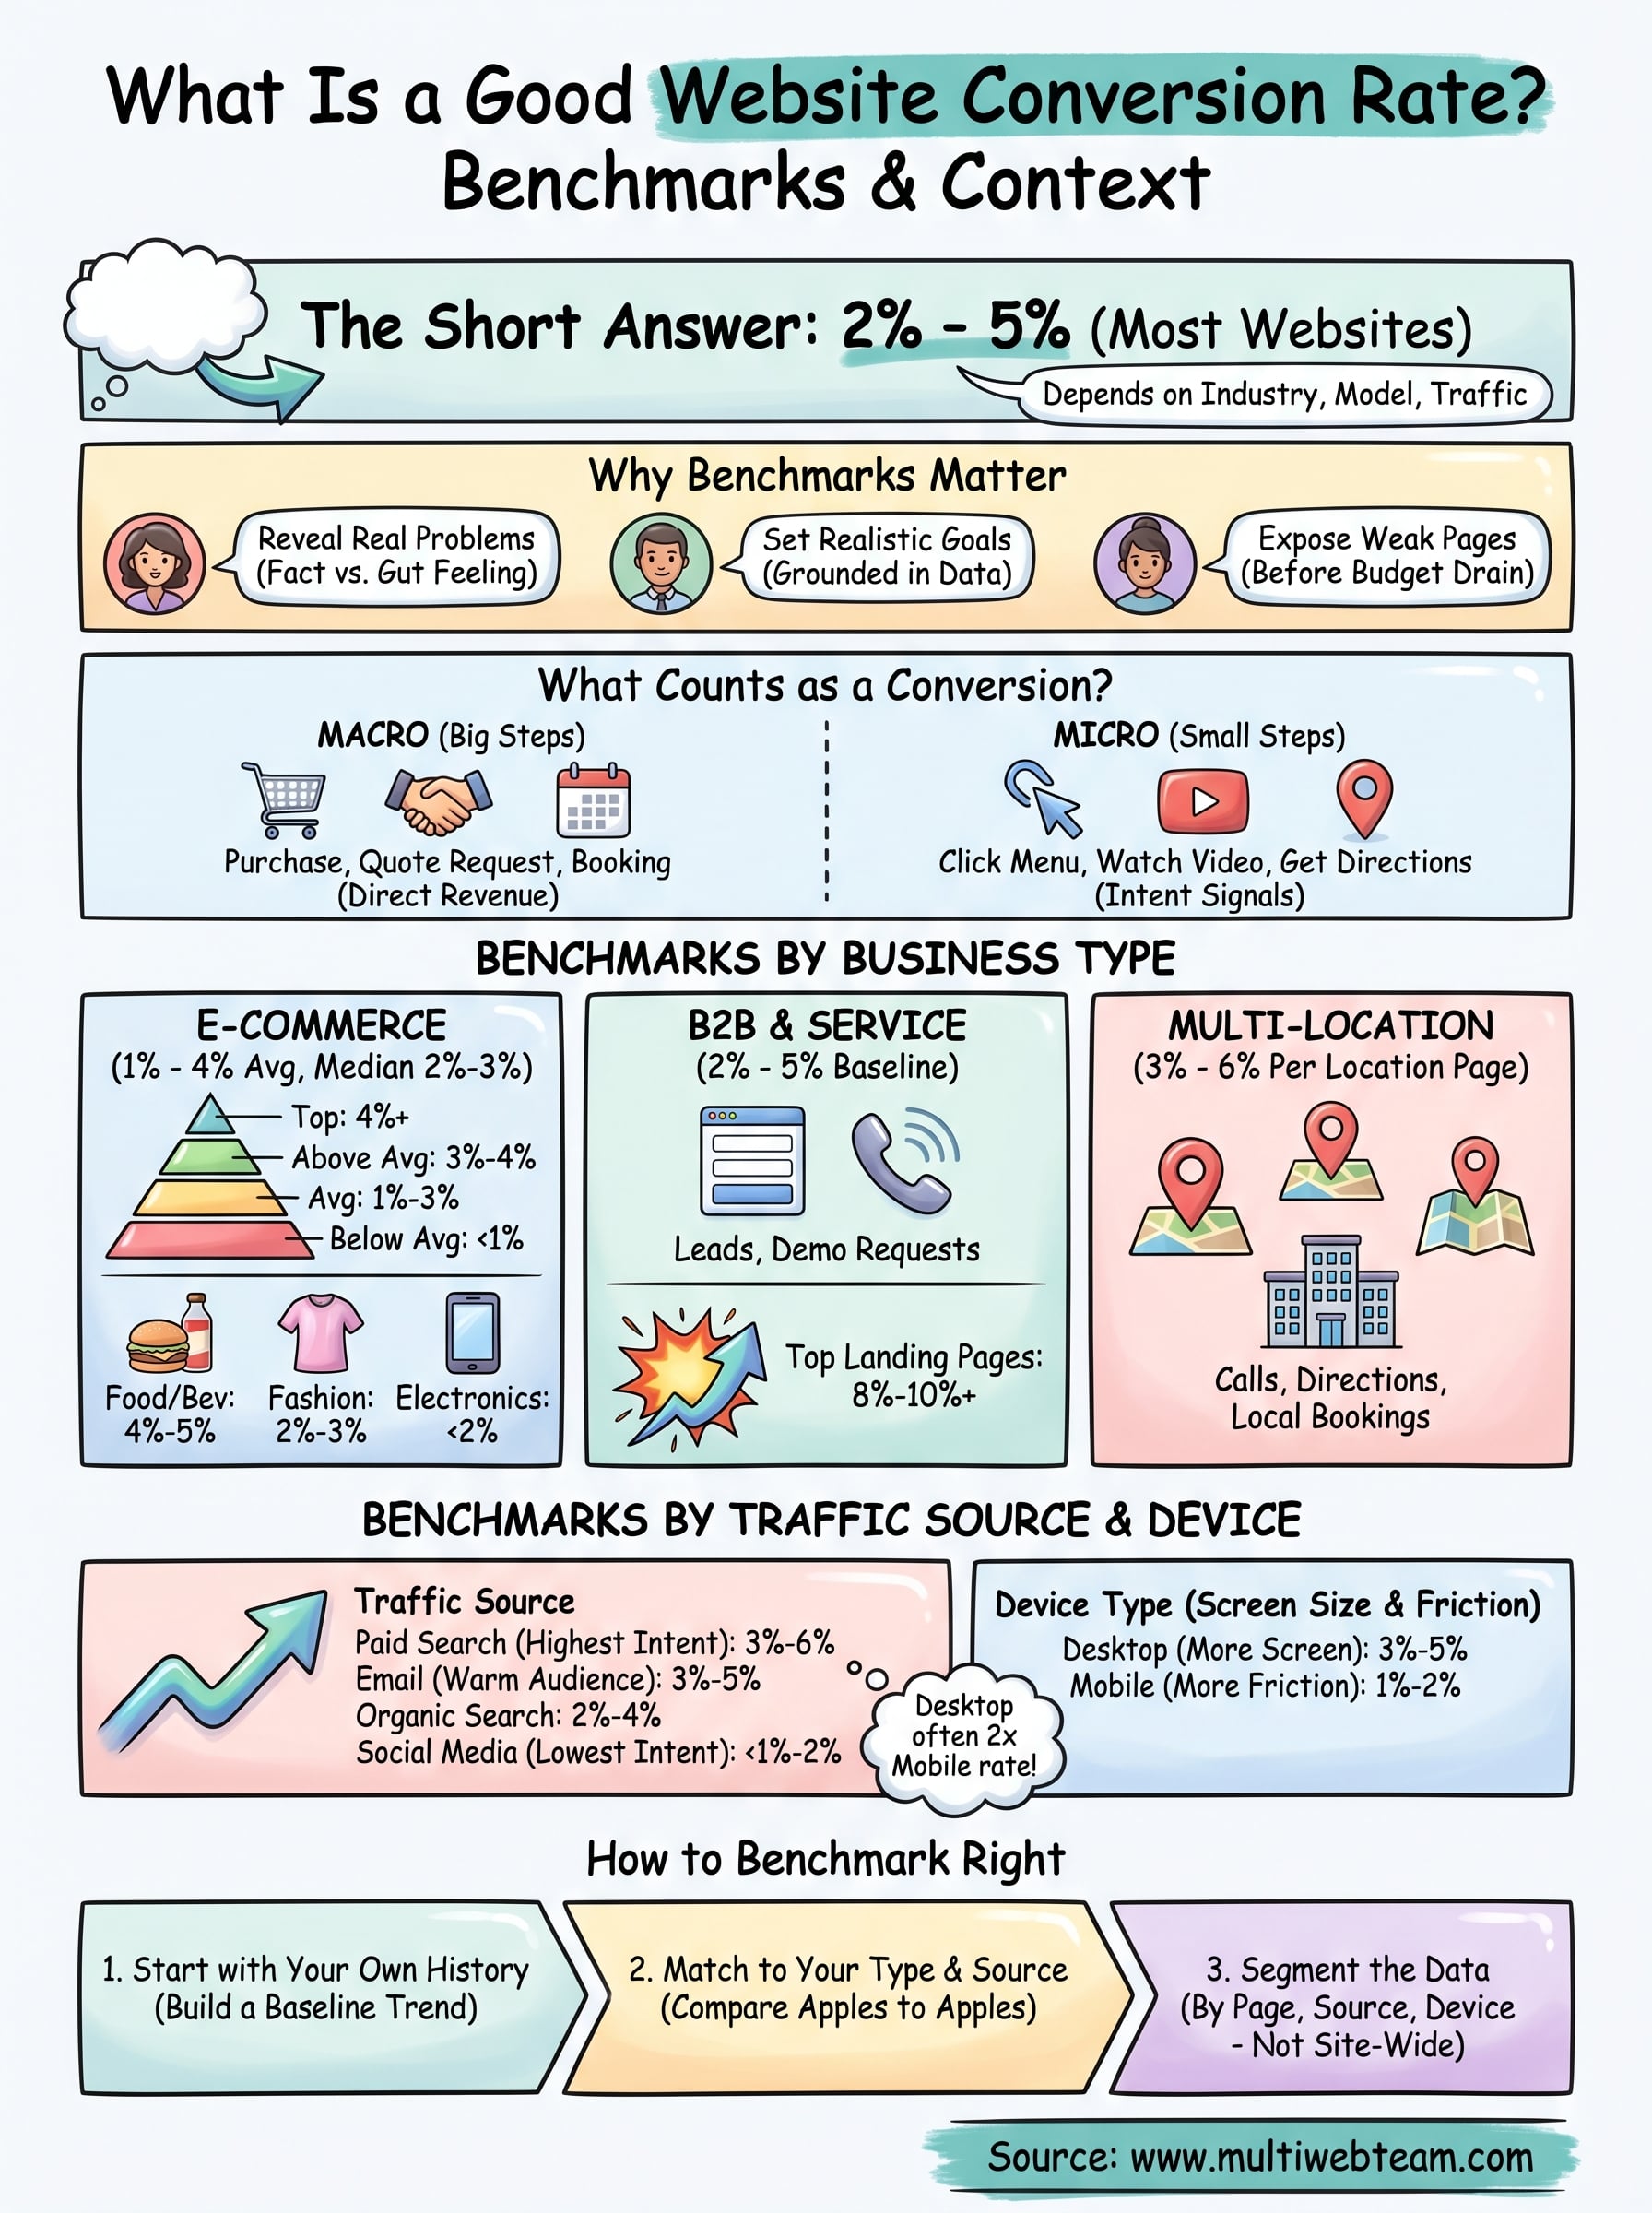
You're getting traffic. People are landing on your site. But if you're wondering what is a good website conversion rate , chances are you suspect your numbers could be better, or you're not sure how to read them in the first place. Either way, you need a benchmark, not a guess. The short answer: most websites convert between 2% and 5% of visitors, but that range shifts significantly depending on your industry, business model, and where your traffic comes from.
The problem is that a single average doesn't tell the full story. An e-commerce site selling shoes operates in a completely different reality than a B2B company generating demo requests, and a multi-location business driving foot traffic has its own conversion dynamics entirely. Comparing yourself to the wrong benchmark leads to the wrong decisions. At Multi Web Team, we build and manage websites for multi-location businesses and franchises, so we see firsthand how conversion rates vary across locations, industries, and traffic sources .
This article breaks down conversion rate benchmarks by business type, traffic channel, and industry so you can figure out exactly where you stand, and what "good" actually looks like for your specific situation. We'll cover how conversion rates are calculated , what factors push them up or drag them down, and where to focus if your numbers fall short .
Why website conversion rate benchmarks matter
Knowing your conversion rate is useful. Knowing whether it's good or bad compared to similar businesses is what actually drives decisions. Without a benchmark, you're flying blind. You might celebrate a 2% rate on your B2B service site when top performers in that category regularly hit 5% or higher. Or you might panic over a 1.5% rate on a paid search landing page, not realizing your industry average sits at nearly the same number. Benchmarks put your data in context , and context is what turns a raw number into a real action.
Benchmarks reveal whether you have a real problem
A lot of businesses spend money on ads, redesigns, and new features based on a gut feeling that something isn't working. Benchmarks replace that gut feeling with a factual comparison . If you're asking what is a good website conversion rate for your specific business type, you're already thinking correctly. The answer tells you whether your current performance is a minor gap to close or a significant drag on your revenue. For a multi-location business, this matters even more because a weak conversion rate across 10 or 20 locations compounds lost revenue quickly .
A single percentage point improvement in conversion rate, applied consistently across multiple locations, can have a larger revenue impact than most paid advertising increases.
Benchmarks help you set goals that are grounded in reality
Setting a conversion rate goal of 10% sounds ambitious, but if your industry average sits at 2%, chasing that number without a clear strategy wastes both time and budget. Realistic goals come from real data , and benchmarks provide exactly that. When you know the top quartile of e-commerce sites in your category converts at around 4% to 5%, you have a concrete target to work toward. You also know that hitting 3% would already put you ahead of the majority of competitors , which changes how you prioritize your efforts.
Your goals also need to account for your specific traffic mix. Paid search traffic typically converts higher than organic traffic because visitor intent is stronger at that point in the funnel. A benchmark that ignores traffic source gives you an incomplete picture , and a goal built on that benchmark is equally flawed. The sections below break down benchmarks by both business type and traffic channel so your targets reflect your actual situation.
Benchmarks expose underperforming pages before they drain your budget
Most websites don't fail at the homepage. They fail on specific landing pages, product pages, or contact forms that quietly underperform without anyone noticing. When you have a benchmark, you can compare individual pages against a standard and identify exactly where visitors are dropping off. For a multi-location business, this might mean one location's landing page converts at 1% while another hits 4%. Without a benchmark, that gap stays invisible . With one, it becomes a clear priority.
Tracking benchmarks over time also protects your budget from gradual decay. Conversion rates can slip slowly as your site ages, your offers shift, or your competitors improve their pages. Catching these drops early through regular comparison against benchmarks prevents small slippage from turning into a significant, sustained revenue loss you only notice months later.
What counts as a website conversion
Before you can figure out what is a good website conversion rate for your business, you need to define what a "conversion" actually means on your specific site. A conversion is any action a visitor takes that moves them toward becoming a customer or contributing to your business goals . That definition sounds broad because it is. A purchase on an e-commerce site counts as a conversion. So does a contact form submission, a phone call click, a newsletter signup, or a store location lookup. The specific action you track depends entirely on what outcome matters most to your business.
Macro conversions vs. micro conversions
Not all conversions carry the same weight. Macro conversions are the primary actions that directly generate revenue or leads, such as completing a purchase, submitting a quote request, or booking an appointment. These are the numbers most businesses report when comparing performance. Micro conversions are smaller steps that signal intent and move visitors closer to that primary action, such as clicking a menu, watching a product video, or adding an item to a cart without checking out.
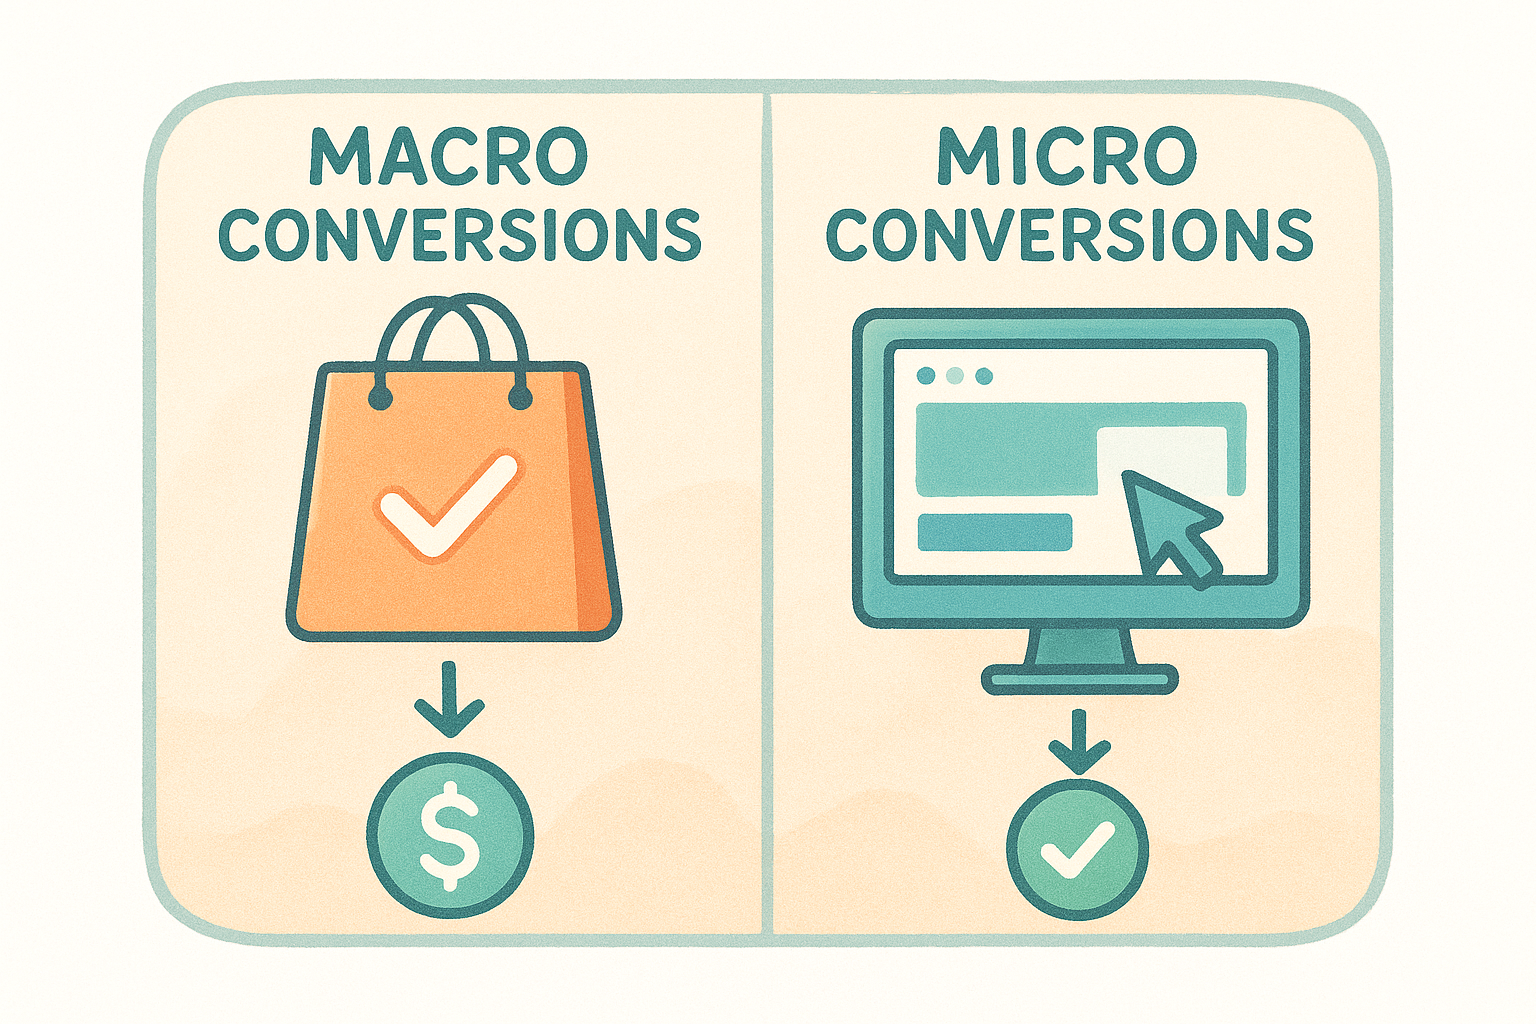
Tracking only macro conversions gives you a final score without showing you where in the game you lost.
Both types matter. If your macro conversion rate drops, micro conversion data helps you pinpoint exactly which step in the funnel broke down . For a multi-location business, micro conversions like "get directions" clicks or "find a location" searches are especially valuable because they indicate visitors who are close to an in-person visit, not just a transaction on your site.
Conversion types by business model
The right conversion to track shifts depending on your business model. Here are the most common types by category:
- E-commerce: completed purchases, cart additions, checkout initiations
- B2B and service businesses: form submissions, demo requests, phone calls, quote inquiries
- Multi-location businesses: location page visits, click-to-call events, direction requests, reservation completions
- Lead generation: email signups, content downloads, free trial registrations
Choosing the wrong conversion as your primary metric leads to optimization work that improves the wrong number. A multi-location restaurant chain that only tracks online orders misses the large share of customers who convert by walking through the door after visiting the site.
How to calculate and track conversion rate
Knowing what is a good website conversion rate only helps when you can measure your own accurately. The formula is straightforward, but which numbers you use and how you configure your tracking will determine whether your data is reliable or misleading.
The basic conversion rate formula
Divide your total conversions by your total visitors or sessions , then multiply by 100. If 2,000 people visited your landing page last month and 60 submitted a contact form, your conversion rate is 3%. That's the math. What trips most businesses up is inconsistency in what they count, which makes month-over-month comparisons unreliable.
The number only means something if you apply the same definition of "conversion" and "visitor" every single time you measure.
You also need to decide whether to track by sessions or unique visitors . Sessions count every visit, including return visits from the same person. Unique visitors count each person once. For service and multi-location businesses, unique visitors typically give you a cleaner read on how well your site converts new potential customers rather than repeat visitors who already know your brand.
Setting up tracking in Google Analytics
Google Analytics 4 is the standard tool for measuring conversion rates, and it's free to use. Inside GA4, you define conversion events such as a thank-you page view after a form submission, a phone number click, or a "get directions" tap on a location page. Once those events are marked as key events, GA4 calculates your conversion rate automatically within the Explorations and Reports sections, broken down by page, traffic source, and device type.
For multi-location businesses, setting up location-specific conversion tracking is worth the extra configuration time. Creating separate landing pages per location and tracking conversions at that level tells you exactly which locations are performing and which are falling short. Without that granularity, a strong performer and a weak one blend into a single average that hides both problems and opportunities.
Check your tracking setup at least once per quarter to confirm all conversion events are firing correctly and that no tags broke during recent site updates. Inaccurate data leads to bad decisions, and acting on numbers you can't trust costs more in the long run than the conversion gap you're trying to close.
Good conversion rates for ecommerce websites
E-commerce is the business type people most often reference when asking what is a good website conversion rate. The widely cited average sits between 1% and 4% , with most studies placing the median closer to 2% to 3% . That range covers a broad swath of online stores, from small niche retailers to large national brands. Hitting 4% or above puts you in the top tier of e-commerce performers, while anything below 1% signals a conversion problem worth investigating immediately.
What the numbers look like across performance tiers
Your e-commerce conversion rate tells you how efficiently your site turns browsers into buyers. The performance landscape breaks into clear tiers that help you gauge where you stand:
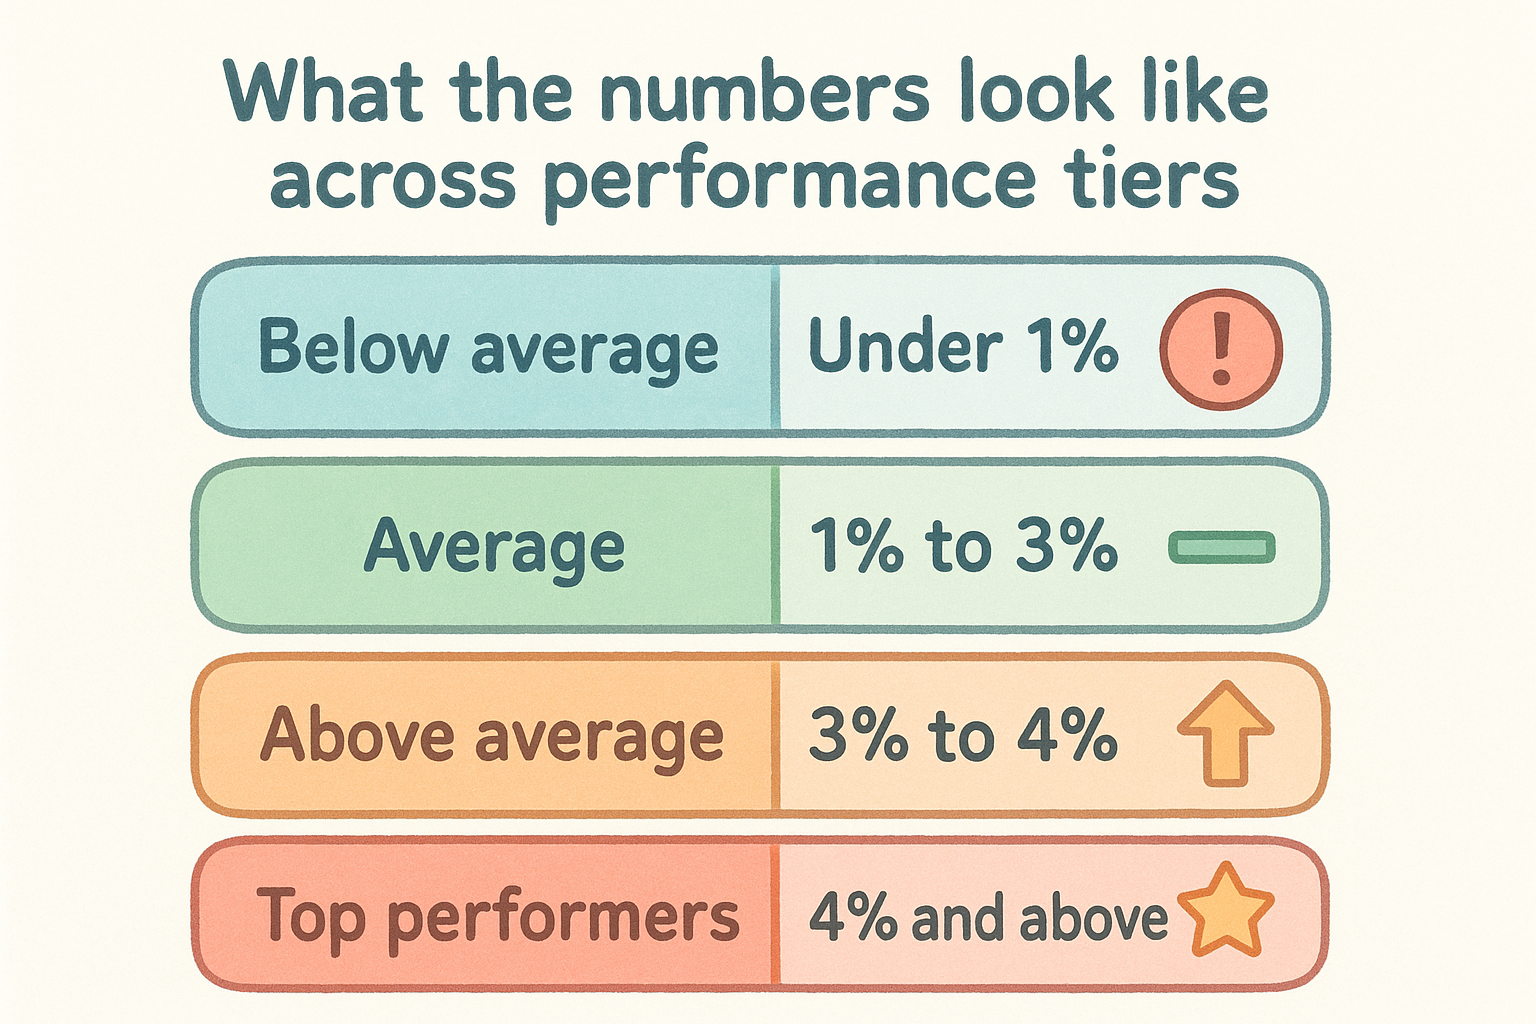
| Performance Tier | Conversion Rate Range |
|---|---|
| Below average | Under 1% |
| Average | 1% to 3% |
| Above average | 3% to 4% |
| Top performers | 4% and above |
These tiers apply broadly, but your specific product category and average order value will shift where the realistic ceiling sits for your store. High-ticket items like furniture or electronics typically convert at the lower end because buyers take longer to decide and often research across multiple sessions before purchasing.
A 3% conversion rate on a $500 product generates significantly more revenue than a 5% rate on a $20 item, so chasing higher rates without factoring in order value can point you in the wrong direction.
How product type and category change your target
Not every e-commerce category shares the same benchmark. Food and beverage stores consistently convert at some of the highest rates in e-commerce, often reaching 4% to 5%, largely because buyers arrive with strong intent and low purchase hesitation. Fashion and apparel sites tend to land around 2% to 3%, partly due to fit concerns and return anxiety that slow decisions.
Health and beauty products sit in a similar range to fashion, while electronics and high-consideration purchases often convert below 2%. If your category naturally skews toward lower rates, comparing yourself against the broad e-commerce average gives you a misleading read. Find benchmarks specific to your product type before you decide whether your current numbers are acceptable or need serious attention.
Good conversion rates for B2B and service websites
B2B and service websites operate under a different set of rules than e-commerce. Visitors rarely convert on their first visit, and the primary goal is usually generating a qualified lead rather than completing a transaction . When you ask what is a good website conversion rate for a B2B or service site, the straightforward answer is that 2% to 5% is a solid baseline , with well-optimized B2B landing pages targeting high-intent traffic regularly reaching 8% to 10%.
Why B2B rates look lower than they are
B2B conversions typically measure form submissions, demo requests, or phone inquiries rather than purchases. These actions require more visitor trust and a longer decision cycle, which naturally keeps raw percentages lower than e-commerce figures. The average B2B site converts between 2% and 4% of visitors, but that number climbs sharply when your pages align tightly with what visitors are searching for.
A 2% conversion rate on a B2B lead form is not a weak result. Depending on your average deal size, even a handful of conversions per month can represent substantial revenue.
Understanding this distinction matters because traffic quality drives B2B performance far more than traffic volume . One hundred highly qualified visitors converting at 4% delivers better business outcomes than a thousand casual browsers converting at 1%. If your rate drops below 1%, you likely have a messaging or targeting problem worth addressing before you increase your ad spend.
Service businesses and multi-location benchmarks
Service businesses, including home services, healthcare, legal, and multi-location franchise concepts, typically convert between 3% and 6% when their pages match visitor intent closely. For a multi-location business, this benchmark applies per location page, not just across the site as a whole. A franchise location page prompting visitors to call, book, or request directions can realistically hit 4% to 5% with the right layout and a clear offer.
Local service pages with strong calls to action and visible contact options consistently outperform generic service overview pages. If you manage multiple locations, tracking the conversion rate per location page surfaces problems that a site-wide average will never reveal. One underperforming location page quietly dragging your overall numbers down is a problem you can only fix once you can actually see it.
Benchmarks by traffic source and device
Where your visitors come from and what device they use when they arrive changes your conversion rate more than most site owners realize. When you're trying to understand what is a good website conversion rate , traffic source and device benchmarks give you a more accurate picture than site-wide averages alone.
How traffic source affects your conversion rate
Paid search traffic consistently converts at the highest rates across almost every business type because visitors arrive with strong, specific intent. They searched for something, saw your ad, and clicked. That intent translates directly into action. Organic search traffic follows closely behind, typically converting between 2% and 4%, while social media traffic tends to convert at 1% or below because those visitors are often browsing rather than actively searching for a solution.
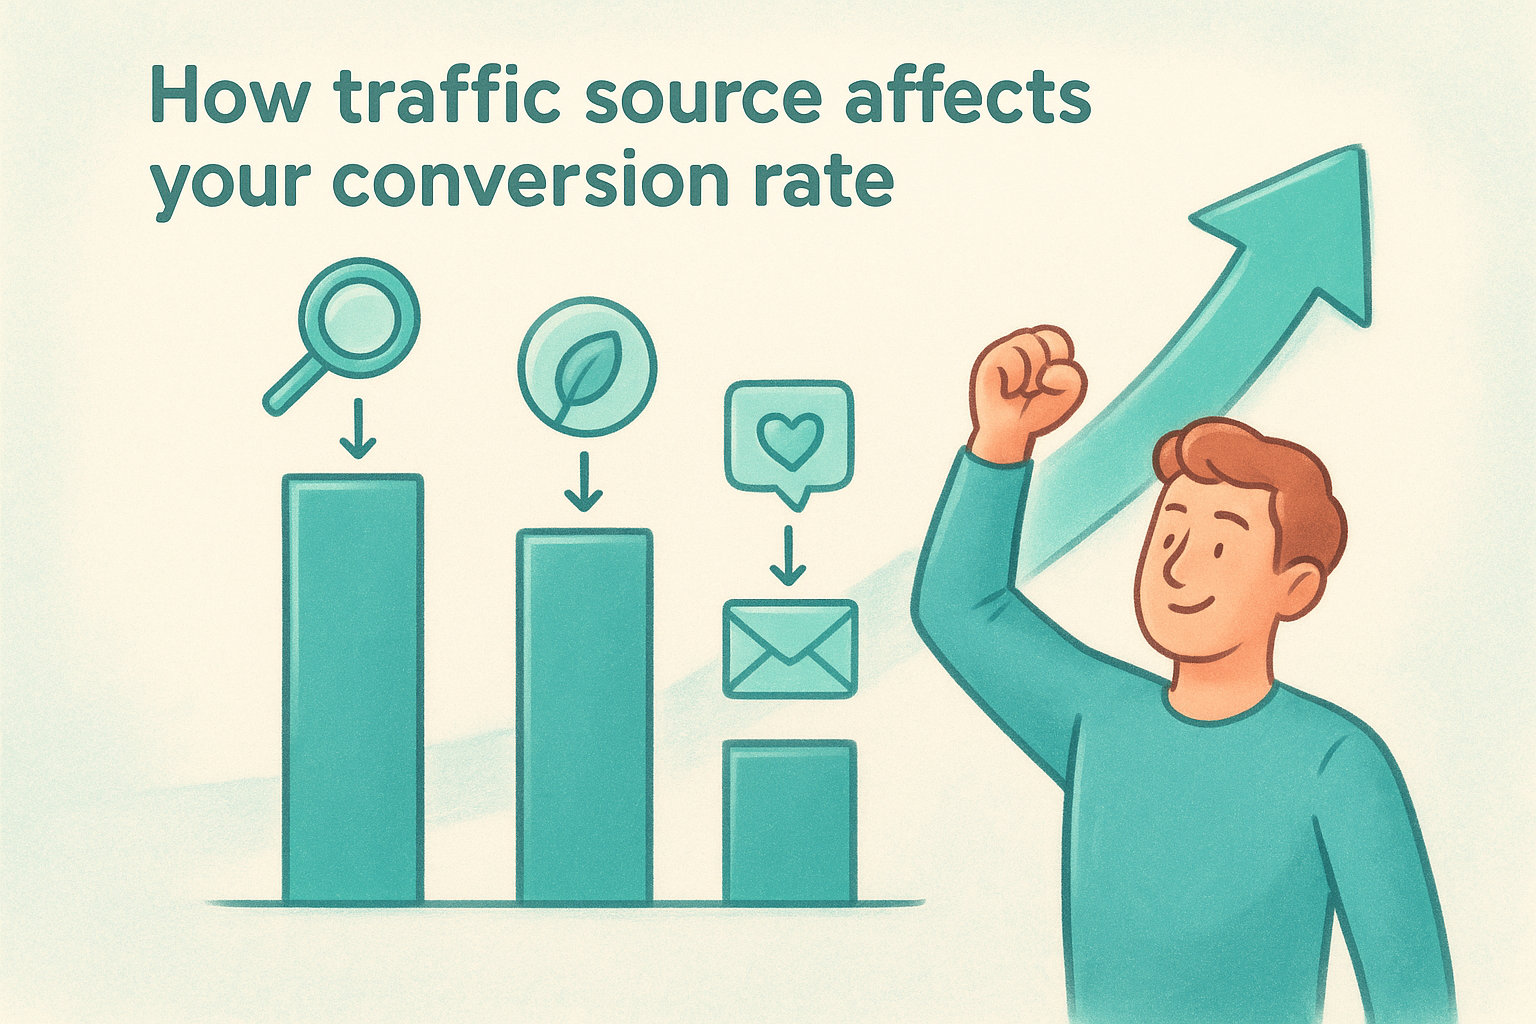
| Traffic Source | Typical Conversion Rate Range |
|---|---|
| Paid search | 3% to 6% |
| Organic search | 2% to 4% |
| 3% to 5% | |
| Referral | 1% to 3% |
| Social media | Under 1% to 2% |
| Direct | 2% to 4% |
Email traffic deserves special attention. Subscribers already know your brand , which removes a major trust barrier and pushes conversion rates to levels that compete with or exceed paid search in many categories.
If your paid search traffic converts below 2%, your landing page and ad message are misaligned, and adding more budget will only scale the problem.
Device type and what it means for your numbers
Desktop users convert at significantly higher rates than mobile users across most industries. A typical desktop conversion rate falls between 3% and 5%, while mobile sits closer to 1% to 2%. Tablet users generally land between those two ranges. This gap exists because mobile visitors face smaller screens, slower load times, and more friction on forms and checkout flows.
For multi-location businesses, mobile matters even more because a large share of your visitors are searching from their phones while on the go. If your location pages load slowly or your contact buttons are hard to tap , you're losing conversions that should be easy to capture. Closing the desktop-to-mobile gap is often one of the fastest ways to lift your overall numbers without increasing ad spend.
How to benchmark your own site the right way
Knowing what is a good website conversion rate in the abstract only takes you so far. The benchmarks in the previous sections give you reference points, but applying them correctly requires matching the right benchmark to the right segment of your site. Treating your site as a single number rather than a collection of pages, traffic sources, and device types leads to conclusions that point you in the wrong direction. The goal is a comparison that reflects your actual situation, not a surface-level check against a number you found in a general article.
Start with your own historical data
Before you compare your numbers against any industry average, build a baseline from your own site's history . Pull your conversion data from the past 12 months and look for trends over time. If your rate has been steady at 2.5% for six months, that number is your real starting point, not an abstract industry figure. Consistent internal data reveals seasonal patterns, traffic shifts, and the real effect of any changes you've already made far better than a one-time snapshot against someone else's benchmark.
Your own trend line matters more than any industry average because it reflects the actual behavior of your specific audience.
Match benchmarks to your actual business type and traffic source
Once you have your baseline, select benchmarks that reflect your actual situation . A multi-location service business should compare against service business benchmarks, not e-commerce averages. A landing page driven by paid search deserves comparison against paid search conversion data, not organic figures. Mixing categories produces a false reading that either inflates confidence or creates unnecessary concern about numbers that are actually performing well for your context.
If your business spans multiple categories, such as a franchise that sells products online and also drives in-store visits, track and benchmark each conversion type separately rather than combining them into one rate that obscures both strengths and problems.
Review benchmarks at the segment level, not the site-wide level
Your overall site conversion rate blends strong pages with weak ones and high-intent visitors with casual browsers. Breaking your data into segments by page, traffic source, device type, and location gives you a far more useful comparison. When you benchmark a specific landing page against paid search averages for your industry, you get an actionable number. When you benchmark a blended site-wide average against a generic figure , you get noise that is difficult to act on.
Next steps to raise your conversion rate
Now that you know what is a good website conversion rate for your business type, traffic source, and device, the next move is acting on that data rather than just tracking it. Start by identifying your single weakest segment , whether that's a specific location page, a mobile checkout flow, or a paid search landing page that underperforms its benchmark. Fix that one problem before spreading attention across your entire site.
From there, build a simple testing process. Run one change at a time , measure the result against your baseline, and repeat. Small, consistent improvements compound into significant gains over months, especially for multi-location businesses where gains apply across every location simultaneously. If you want a web team that builds and manages sites specifically designed to convert across multiple locations, Multi Web Team handles the design, updates, and optimization so you can focus on running your business.